![]()
When it comes to project management, clarity is everything. Whether you're mapping out workflows, visualizing timelines, or aligning teams around complex processes, having the right tools makes all the difference. Enter Microsoft Visio, a powerful diagramming solution that often flies under the radar in the project management world.
Microsoft Visio is a powerful diagramming tool that helps project managers visualize workflows, timelines, and organizational structures with precision. While many professionals rely on tools like Gantt charts or Kanban boards, Visio offers a more visual and flexible approach to planning, executing, and monitoring projects.
But how exactly do you harness its full potential for project success? In this guide, we'll walk you through practical ways to use Microsoft Visio to streamline your project management process, enhance communication, and bring your ideas to life.
Here’s how project managers can leverage Visio effectively:
1.Start With A Template
Open Visio and select a project-related template such as ‘Gantt Chart,’ ‘Timeline,’ or ‘Cross-Functional Flowchart.’ These templates come preloaded with relevant shapes and layout settings.
2.Define Project Phases
Break your project into phases, e. g. , strategy development, implementation, and review. Create separate pages or swim lanes for each phase.
3.Build A Timeline
Use the ‘Timeline’ shape to represent your project duration. Add milestones, intervals, and markers to visualize key dates.
4.Add A Gantt Chart
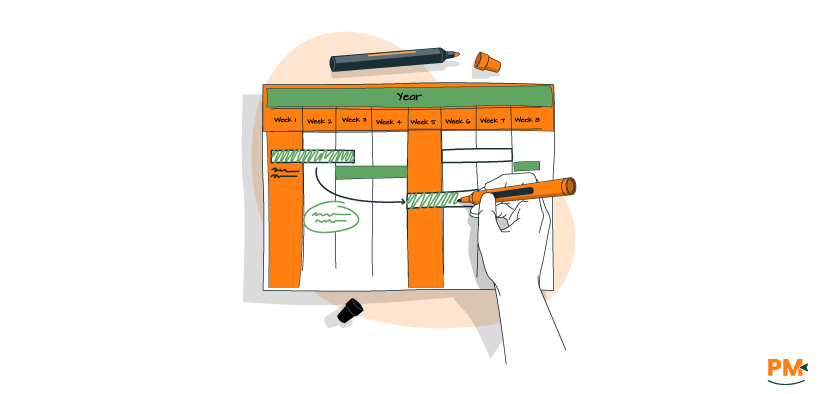
Insert a Gantt chart to schedule tasks, assign durations, and define dependencies. This helps track progress and identify bottlenecks.
5.Create Flowcharts
Design flowcharts to map out processes within each phase. Use connectors to show task sequences and decision points.
6.Use Cross-Functional Flowcharts
Set up swim lanes to represent different teams or roles. This clarifies responsibilities and improves accountability.
7.Link Data To Shapes
Import data from Excel or other sources and link it to Visio shapes. Use data graphics to visualize status, cost, or resource allocation.
8.Add Hyperlinks And Navigation
Create hyperlinks between pages or shapes to enable easy navigation across diagrams. This is especially useful for large projects.
9.Customize And Share
Apply themes, adjust layouts, and export diagrams to Word, PDF, or SharePoint for stakeholder review.
Microsoft Visio empowers project managers to build clear, structured workflows that enhance team coordination and process transparency. Using flowcharts, swimlane diagrams, and process maps, you can visually represent tasks, responsibilities, and timelines across departments and roles.
Flowcharts: Mapping Task Sequences And Decision Points
Flowcharts are foundational tools in Visio for illustrating linear or branching workflows. They help project managers:
- Define task sequences and dependencies
- Highlight decision points using standardized symbols (e. g. , diamonds for decisions, rectangles for actions)
- Identify bottlenecks or redundant steps in a process
To create a flowchart in Visio:
- Open Visio and select the Basic Flowchart template
- Drag shapes from the Flowchart Shapes pane onto the canvas
- Use connectors to link tasks and decisions logically
- Customize with labels, colors, and annotations for clarity
Flowcharts are especially useful during project planning and process optimization phases.
Swimlane Diagrams: Clarifying Roles And Responsibilities
Swimlane diagrams, also known as cross-functional flowcharts, organize workflows by team, role, or department. Each ‘lane’ represents a stakeholder or function, making it easy to assign ownership and visualize handoffs.
Key Benefits:
- Clarifies who is responsible for each task
- Reduces ambiguity in multi-team projects
- Highlights interdependencies across roles
How To Build A Swimlane Diagram In Visio?
- Select the ‘Cross-Functional Flowchart’ template
- Choose horizontal or vertical swimlane orientation
- Drag swimlane shapes from the Shapes pane and label each lane (e. g. , IT, QA, Support)
- Add process shapes to the appropriate lanes
- Use connectors to show task flow and transitions between roles
Example: In a software rollout plan, swimlanes can represent IT (setup), QA (testing), and Support (deployment), clearly delineating responsibilities across phases.
Process Mapping: Visualizing Operations And Identifying Bottlenecks
Process maps provide a high-level view of how tasks flow from initiation to completion. Visio’s Business Process Modeling Notation (BPMN) and Workflow Diagram templates are ideal for:
- Documenting standard operating procedures
- Analyzing inefficiencies or delays
- Aligning teams on process expectations
Steps To Create A Process Map In Visio:
- Choose a relevant template (e. g. , BPMN or Workflow)
- Define swimlanes or stages to segment the process
- Add shapes for each step, decision, or document
- Connect steps using directional arrows
- Annotate with notes, conditions, or outcomes
Process maps are especially valuable for onboarding, compliance audits, and continuous improvement initiatives.
Visio supports Gantt chart creation through its ‘Schedule’ template:
- Set Up: Select ‘Gantt Chart’ from the ‘Schedule’ category and define your project’s start and end dates
- Add Tasks And Milestones: Each task occupies a row; durations are represented as bars. Milestones have zero duration
- Link Dependencies: Use arrows to connect tasks and reflect sequencing
Organizational charts (org charts) in Microsoft Visio provide a clear, visual representation of team structures, reporting relationships, and role assignments within a project.
Org Chart Wizard: Automate With Excel Or Active Directory
Visio’s Organization Chart Wizard streamlines chart creation by importing data from external sources like Excel, Active Directory, or Exchange Server.
Steps To Use The Wizard:
- Go to File> New > Organization Chart and select Create
- Choose Information that’s already stored in a file or database
- Select your data source (e. g. , Excel workbook) and map fields such as:
- Name
- Reports To
- Title
- Optional: Department, Email, Phone, etc
- Visio automatically generates shapes and connectors based on the hierarchy
- You can include employee photos and customize layout options across multiple pages
This method is ideal for large teams or organizations with structured HR data.
Manual Creation: Build From Scratch With Drag-And-drop

For smaller teams or custom layouts, Visio allows manual org chart creation:
- Open the ‘Organization Chart’ template
- Drag shapes (e. g. , ‘Executive,’ ‘Manager,’ ‘Position’) from the ‘Shapes’ pane onto the canvas
- Use connectors to define reporting lines
- Double-click shapes to enter names, titles, and other details
- Arrange shapes using layout options like ‘Top Down,’ ‘Side-by-Side,’ or ‘Left to Right’
Manual creation offers full control over design and structure, making it ideal for project-specific org charts or visual brainstorming.
Customization: Enhance Clarity And Visual Appeal
Visio supports extensive customization to make org charts more informative and visually engaging:
- Add Photos : Insert employee images for personalization
- Include Contact Info: Add email, phone, and department details via shape data
- Use Team Frames: Group roles into virtual teams using the Team Frame shape
- Apply Themes: Use Visio’s design tab to adjust colors, fonts, and layout styles
- Hyperlink Shapes : Link roles to internal documents, project pages, or external profiles
These enhancements help stakeholders quickly understand team composition and access relevant resources.
Use Cases In Project Management
Org charts are essential for:
- Defining project roles and responsibilities
- Clarifying reporting structures across departments
- Onboarding new team members
- Communicating team hierarchy to external stakeholders
Example: In a cross-functional product launch, an org chart can show how marketing, engineering, and operations report to different leads while collaborating under a unified project manager.
Visio integrates seamlessly with:
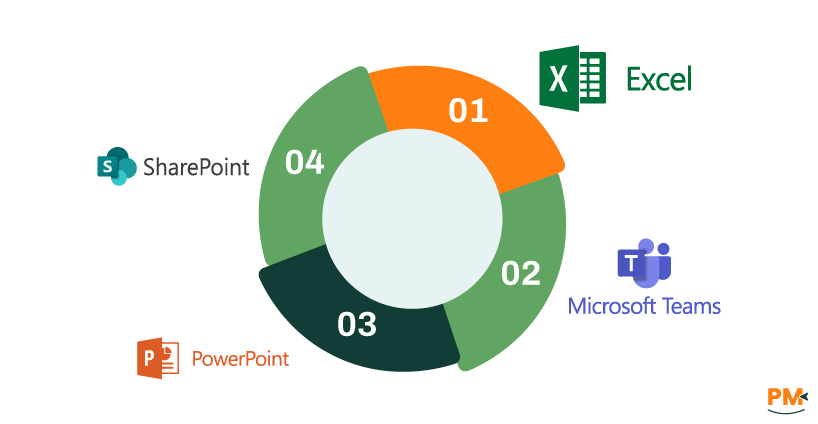
Tool | Integration Benefit |
Excel | Import data to auto-generate flowcharts and org charts |
Microsoft Teams | Collaborate in real time with comments and mentions |
PowerPoint | Embed diagrams for presentations and stakeholder updates |
SharePoint | Version control and centralized access to diagrams |

Visio helps visualize risk frameworks and compliance workflows:
- Risk Matrices: Plot likelihood vs. impact for various risks
- Decision Trees: Model approval paths and escalation protocols
- Compliance Diagrams: Document regulatory processes like GDPR or PCI DSS
Example: Financial institutions use Visio to model credit risk and audit workflows.
Creating professional, readable, and consistent diagrams in Visio requires more than just technical know-how—it demands thoughtful design choices that enhance clarity, usability, and collaboration. Below are key best practices to help project managers and teams get the most out of Visio.
Standardize Symbols And Shapes
Using consistent shapes across diagrams improves readability and reinforces meaning:
- Rectangles for processes
- Diamonds for decisions
- Ovals for start/end points
- Arrows for flow direction
Standardization helps viewers quickly interpret diagrams and reduces confusion. Consider creating a custom stencil set for your organization to maintain uniformity across projects.
Maintain Clarity And Visual Hierarchy
Clarity is critical in project documentation. To achieve it:
- Avoid clutter: Limit each diagram to 10–15 steps or break into modular sections
- Use whitespace: Space out elements to prevent visual overload
- Group logically: Align related shapes and use swimlanes or containers to organize content
- Limit colors: Use a minimal palette to highlight key elements without distraction
Readable diagrams allow stakeholders to grasp workflows and reduce miscommunication.
Use Templates And Themes
Visio’s built-in templates (e. g. , Gantt Chart, Flowchart, Org Chart) provide pre-configured layouts and shape libraries that save time and ensure accuracy. Themes help maintain visual consistency:
- Apply consistent fonts, line styles, and colors
- Use layout tools like Auto Align and Distribute to maintain symmetry
- Leverage Quick Styles for shape formatting
Templates also support compliance with internal documentation standards.
Implement Version Control And Collaboration
To ensure traceability and team alignment:
- Store diagrams in SharePoint or Teams for centralized access
- Use Visio for the web to enable real-time co-authoring and commenting
- Maintain a version history to track edits and approvals
- Include metadata such as author, date, and revision notes directly in the diagram
- This fosters transparency and reduces the risk of outdated or conflicting documentation.
Label Clearly And Use Descriptive Text
Every shape should include meaningful labels:
- Avoid jargon unless the audience is technical
- Use concise, action-oriented phrasing
- Add annotations or callouts for complex steps
- Ensure text is legible—minimum font size of 10pt is recommended
- Clear labeling improves comprehension and supports onboarding, audits, and stakeholder reviews.
Test Diagrams With Stakeholders
Before finalizing:
- Share drafts with team members for feedback
- Validate that the diagram reflects actual workflows
- Confirm that symbols and labels are intuitive to non-technical users
- Adjust layout based on usability insights
- Testing ensures diagrams are not only accurate but also user-friendly
Can Microsoft Visio be used to create Gantt charts for project timelines?
Yes. Visio’s Gantt Chart template allows you to schedule tasks, set dependencies, and track progress visually.
Is Microsoft Visio suitable for Agile project management?
While Visio isn’t a full Agile tool, it can model sprints, workflows, and Kanban-style diagrams using custom templates.
Can I import data from Excel into Visio for project diagrams?
Absolutely. Use the Data Visualizer add-in to convert Excel tables into flowcharts and org charts.
Does Visio support real-time collaboration with team members?
Yes. Visio for the web supports co-authoring and commenting via Microsoft Teams and SharePoint.
Is there a difference between Visio Standard and Visio Professional for project management?
Yes. Visio Professional includes advanced templates, data linking, and integration features not available in the Standard version.